Prometheus安装使用
下载安装prometheus服务端
从官方网站 下载相应版本
tar xf prometheus-2.5.0.linux-amd64.tar.gz -C /usr/local/
cd /usr/local
ln -s prometheus-2.5.0.linux-amd64 prometheus
直接使用默认配置文件启动
cd /usr/local/prometheus
./prometheus --config.file=./prometheus.yml &
查看端口是否已经启动
[root@localhost prometheus]# ss -utnalp  grep 9090
tcp LISTEN 0 128 :::9090 :::* users:((prometheus,pid=4893,fd=6))
浏览器访问 http://192.168.57.3:9090/
默认只监控了本机一台,点Status –》点Targets –》可以看到只监控了本机
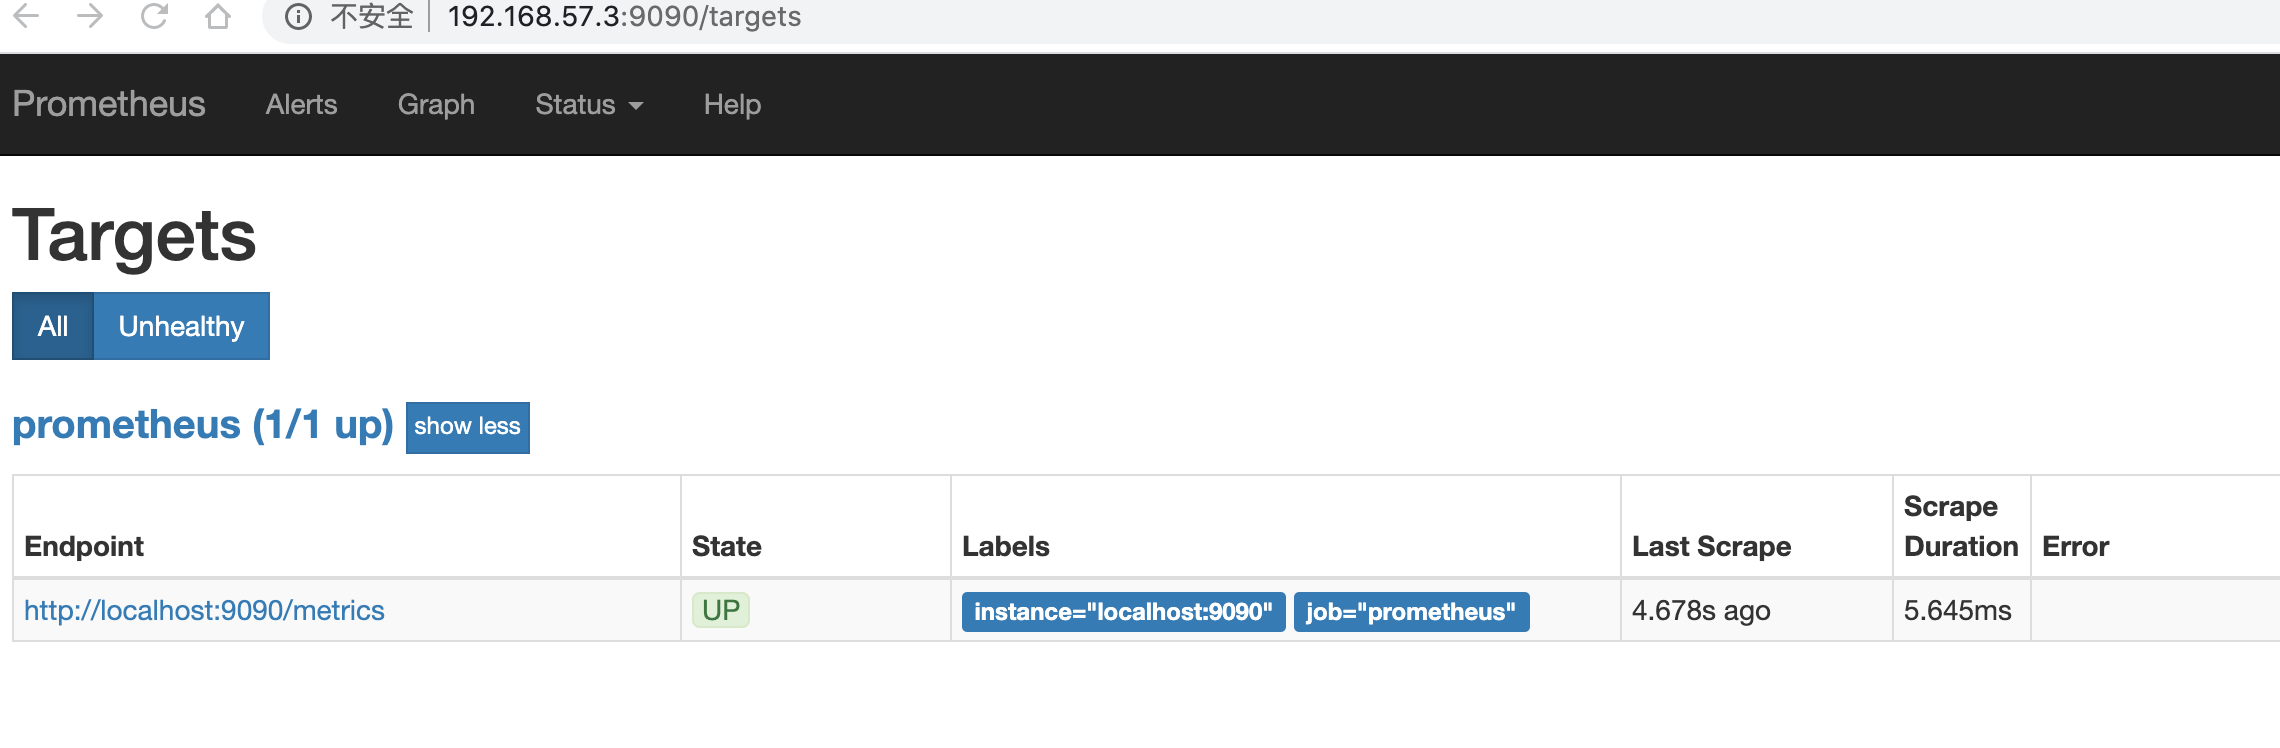
查看metrics http://192.168.57.3:9090/metrics;
监控远程主机
安装node_exporter
tar xvf node_exporter-0.16.0.linux-amd64.tar.gz -C /usr/local/
cd /usr/local
ln -s node_exporter-0.16.0.linux-amd64/ node_exporter
直接启动
cd node_exporter
nohup ./node_exporter &
查看端口服务是否启动
[root@localhost node_exporter]# ss -utnalp grep 9100
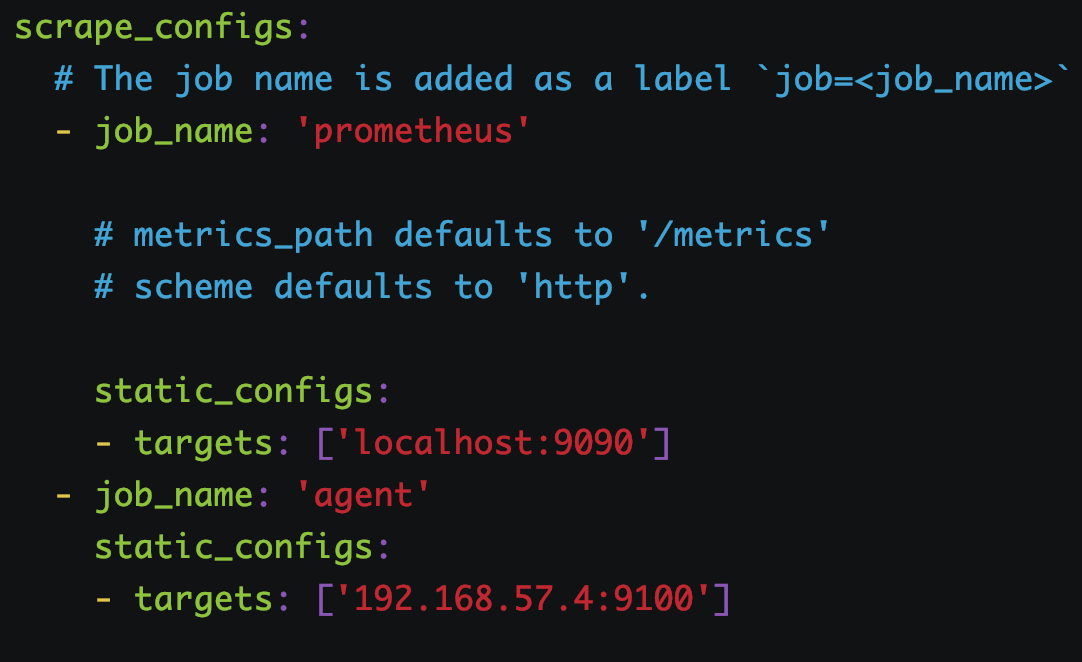
tcp LISTEN 0 128 :::9100 :::* users:((node_exporter,pid=6403,fd=3))回到prometheus服务器的配置文件里添加被监控机器的配置段
vim /usr/local/prometheus/prometheus.yml
插入最下面那三行,重启prometheus服务器
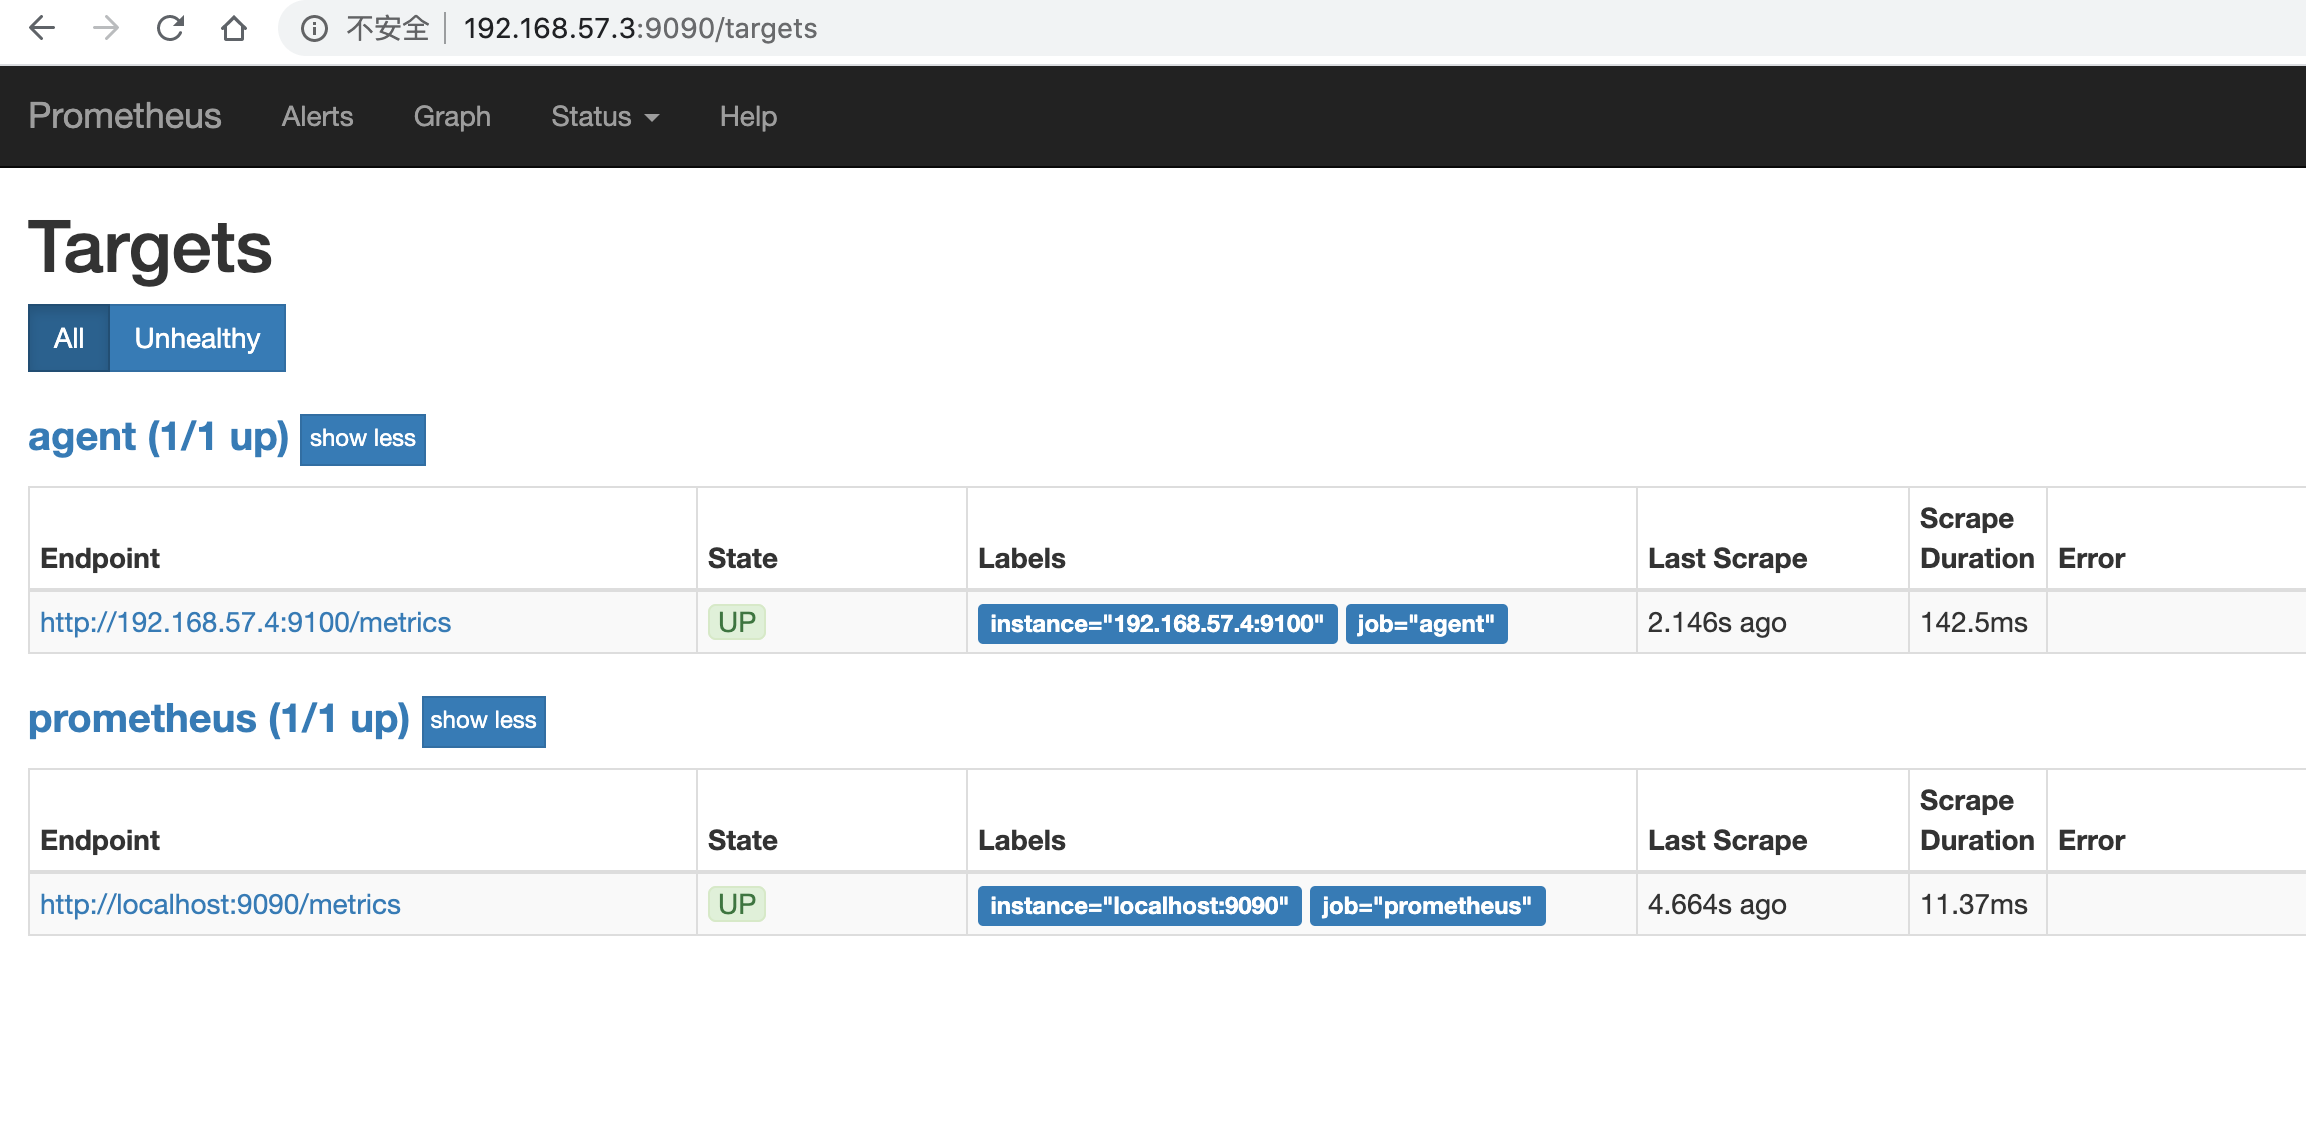
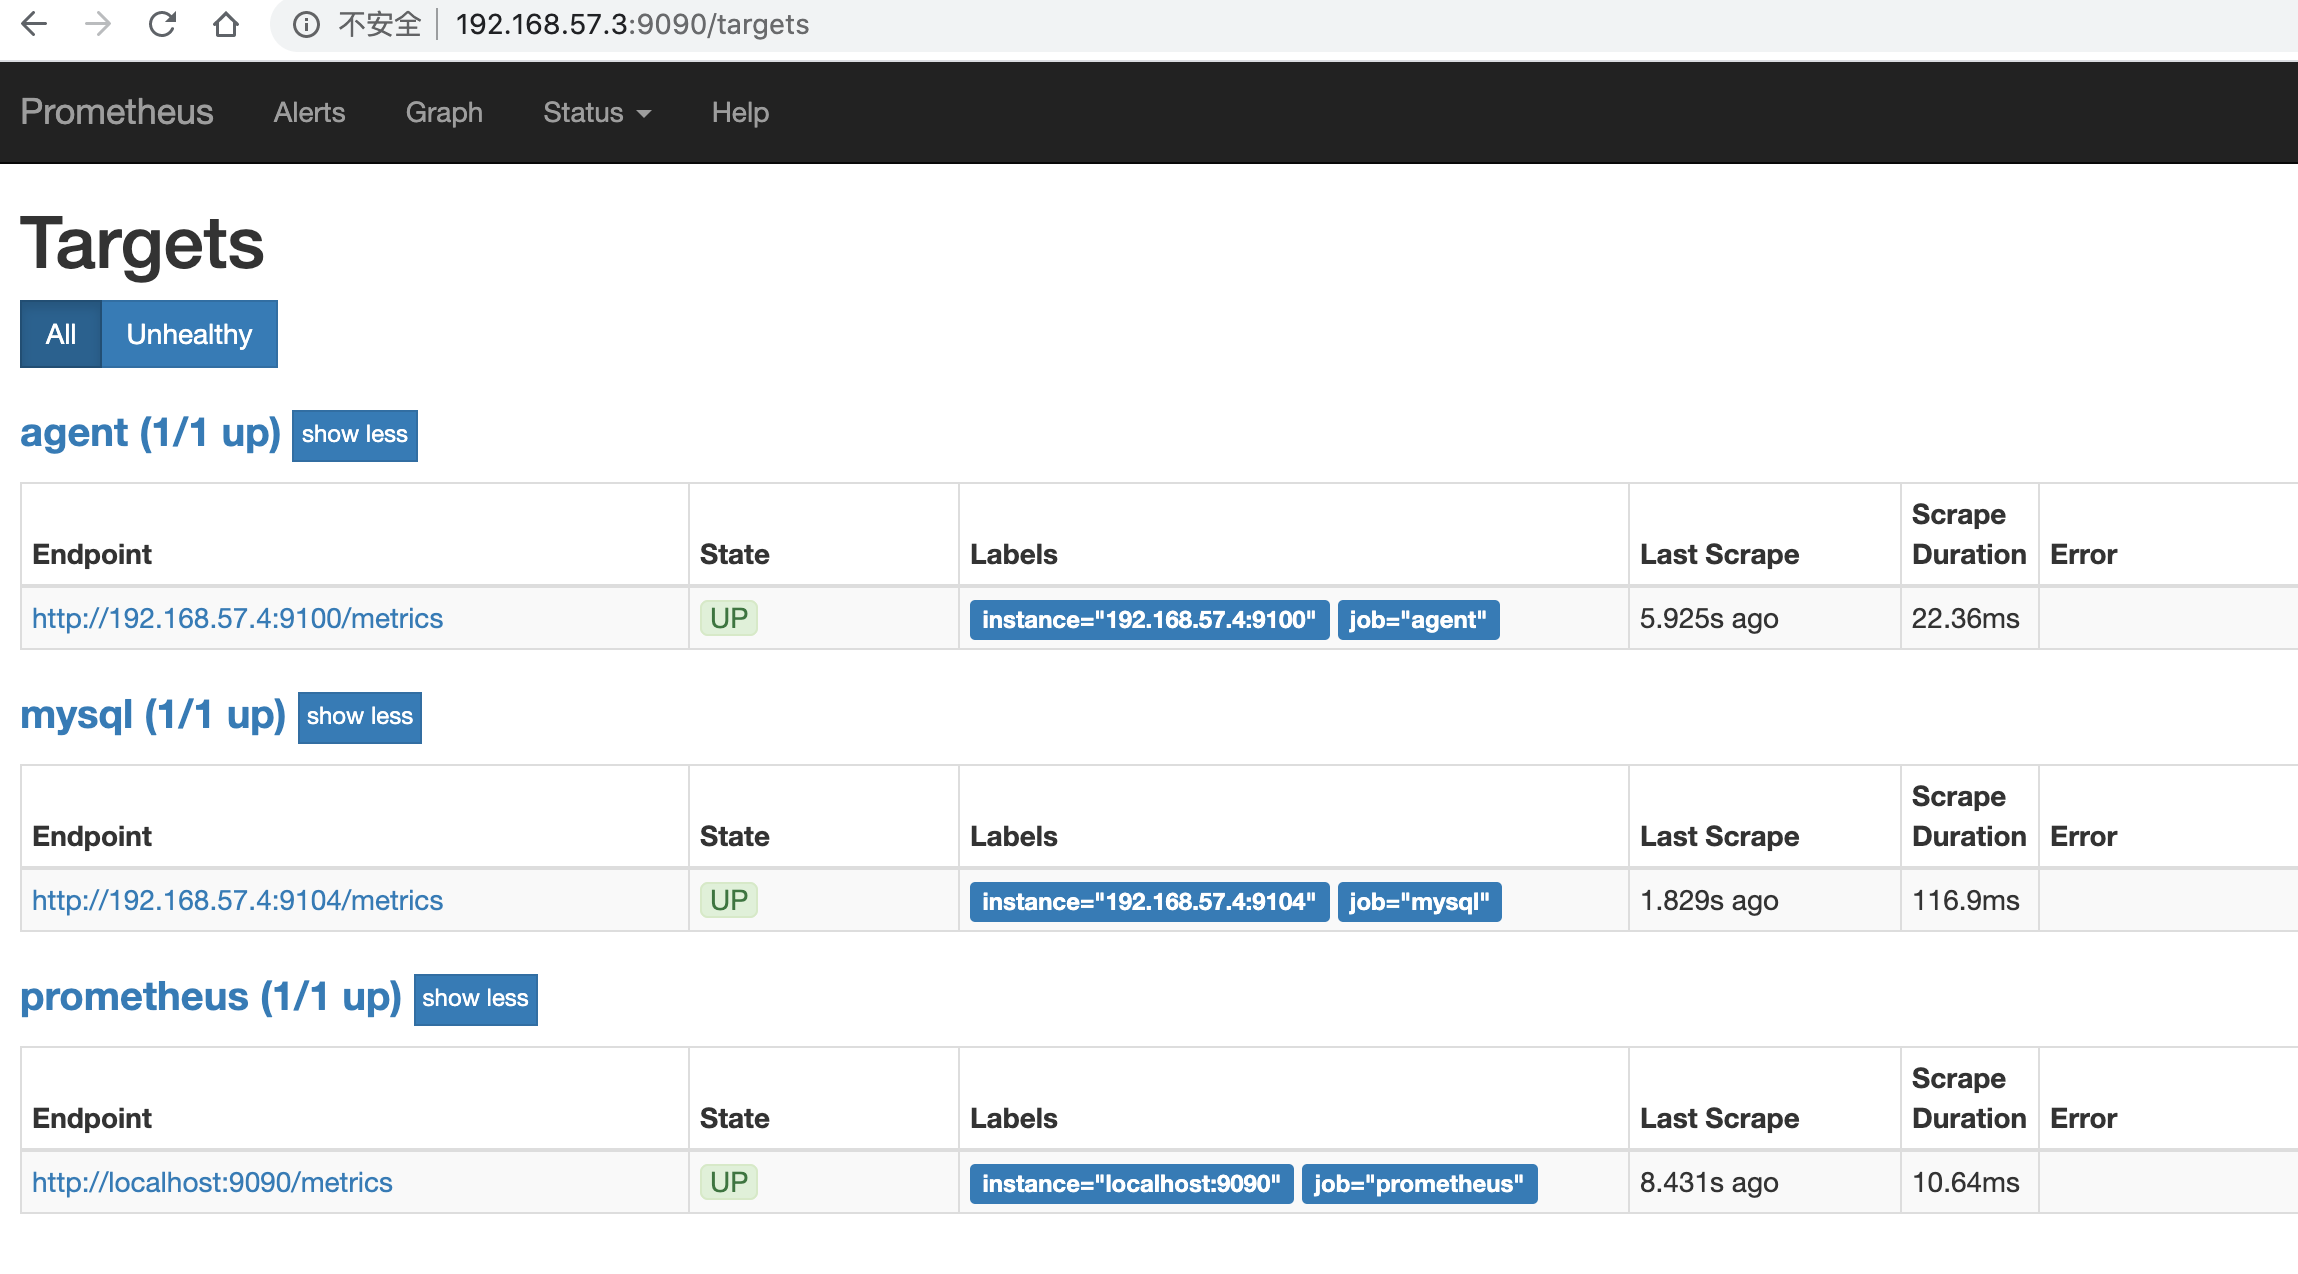
再次访问prometheus服务器,发现已经多出来一台监控主机
监控mysql
在被管理机agent上安装mysqld_exporter组件
下载地址: http://prometheus.io/download/
tar xvf mysqld_exporter-0.11.0.linux-amd64.tar.gz -C /usr/local/
cd /usr/local
ln -s mysqld_exporter-0.11.0.linux-amd64/ mysqld_exporter
添加授权用户,
grant select,replication client,process ON *.* to 'mysql_monitor'@'localhost' identified by '123';
flush privileges;
创建mysqld_exporter启动授权文件
vim /usr/local/mysqld_exporter/.my.cnf
[client]
user=mysql_monitor
password=123
启动mysqld_exporter
nohup ./mysqld_exporter --config.my-cnf=.my.cnf &回到prometheus服务器的配置文件里添加被监控机器的配置段
vim /usr/local/prometheus/prometheus.yml
插入最下面那三行,重启prometheus服务器
- job_name: 'mysql'
  static_configs:
  - targets: ['192.168.57.4:9104']
再次访问prometheus服务器,发现已经多出来一台监控主机
安装Grafana可视化图形工具
在grafana服务器上安装grafana
下载地址:http://grafana.com/grafana/download
yum localinstall -y grafana-5.3.4-1.x86_64.rpm启动服务
systemctl start grafana-server浏览器访问 http://192.168.57.5:3000,默认账户密码都是admin,第一次登陆需要修改密码
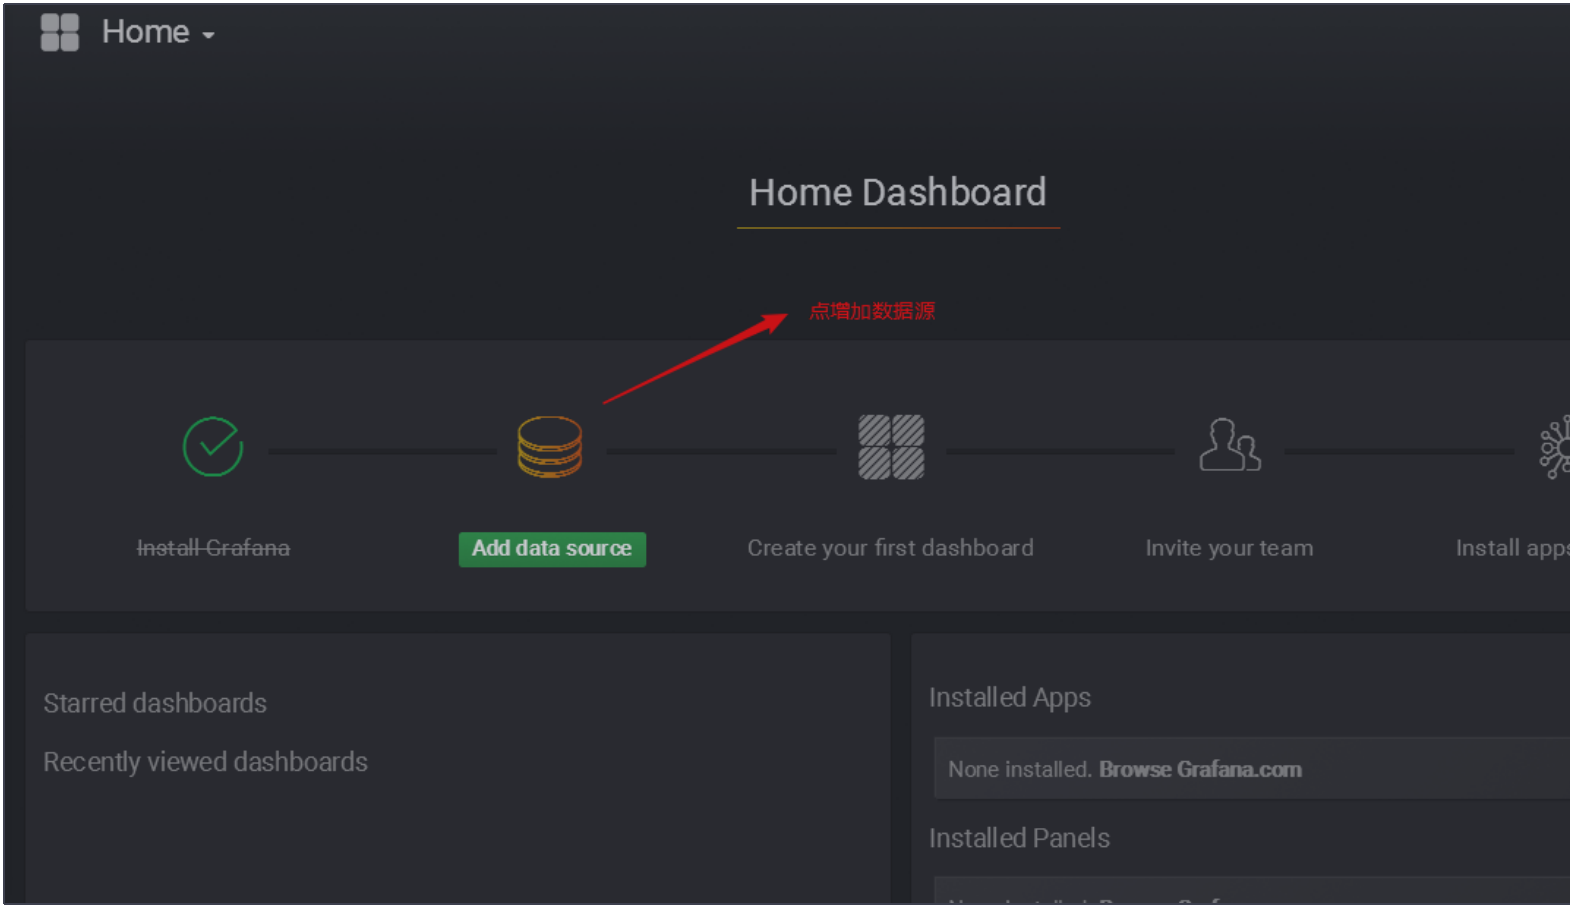
添加数据源
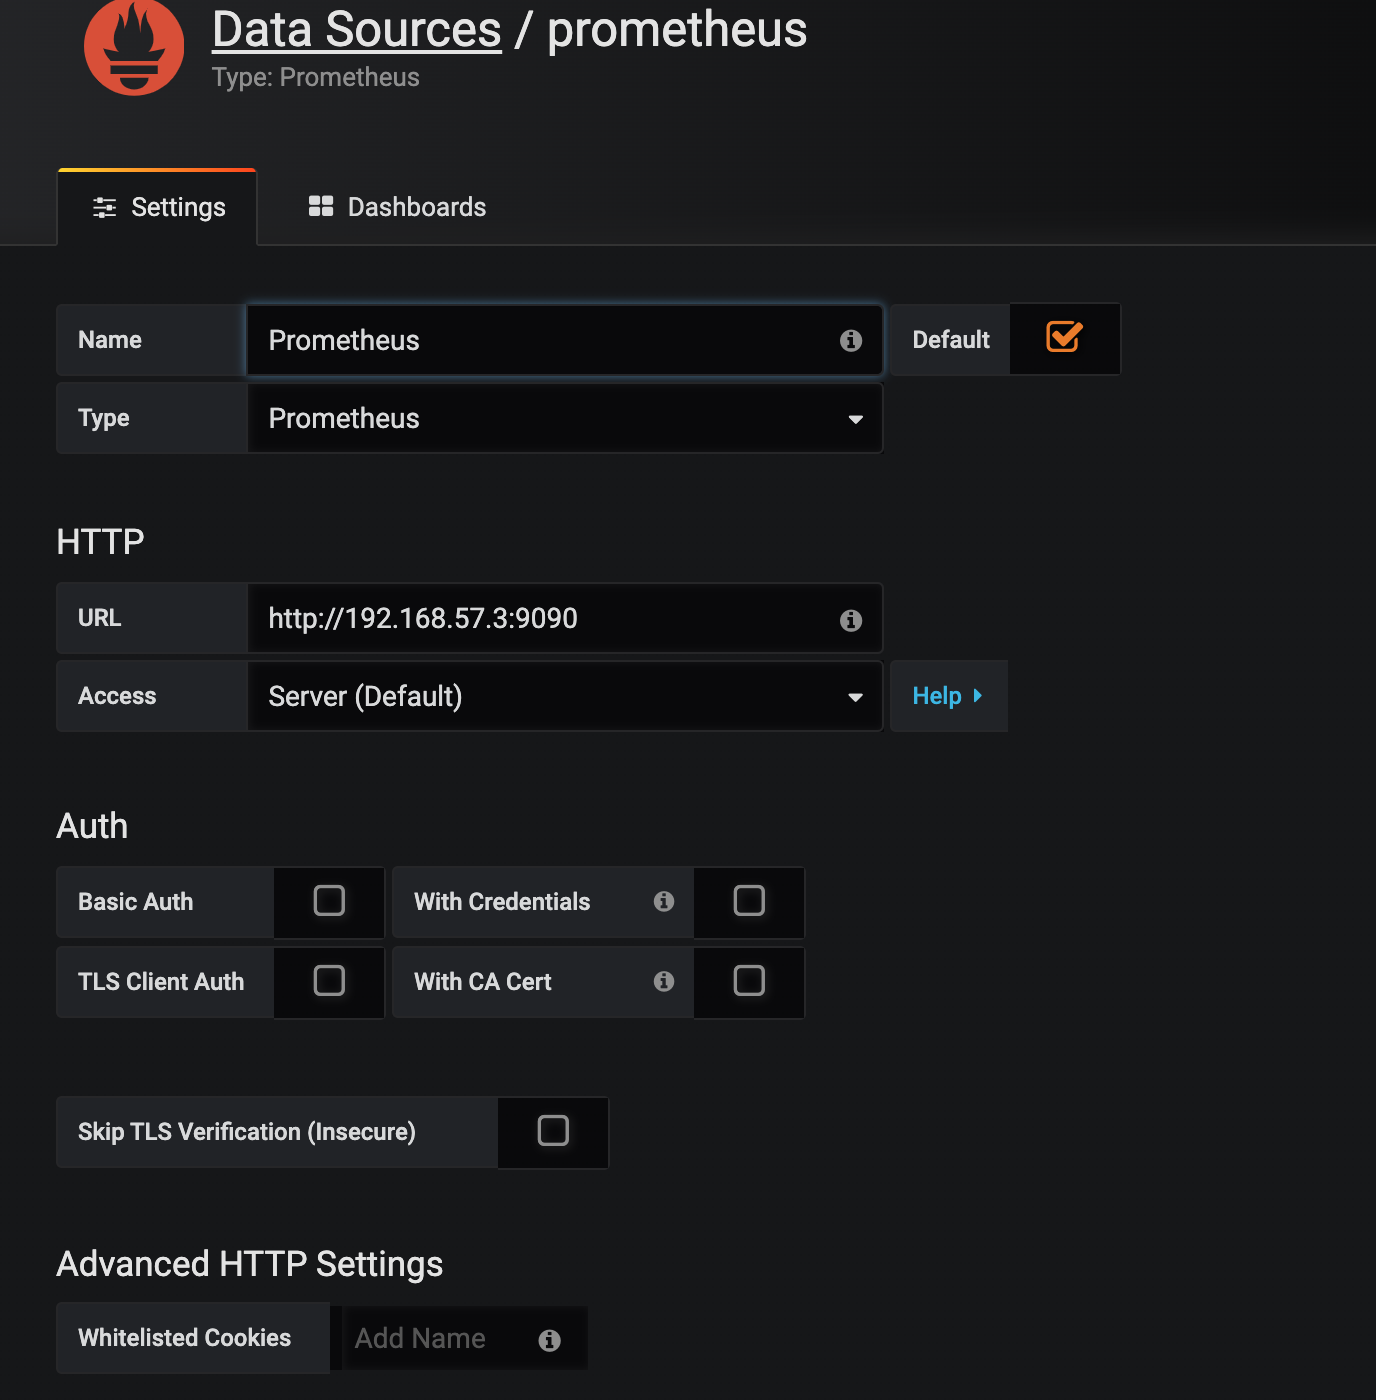
name这里填prometheus,类型type选择prometheus,设置prometheus的服务器地址,我这里是http://192.168.57.3:9090
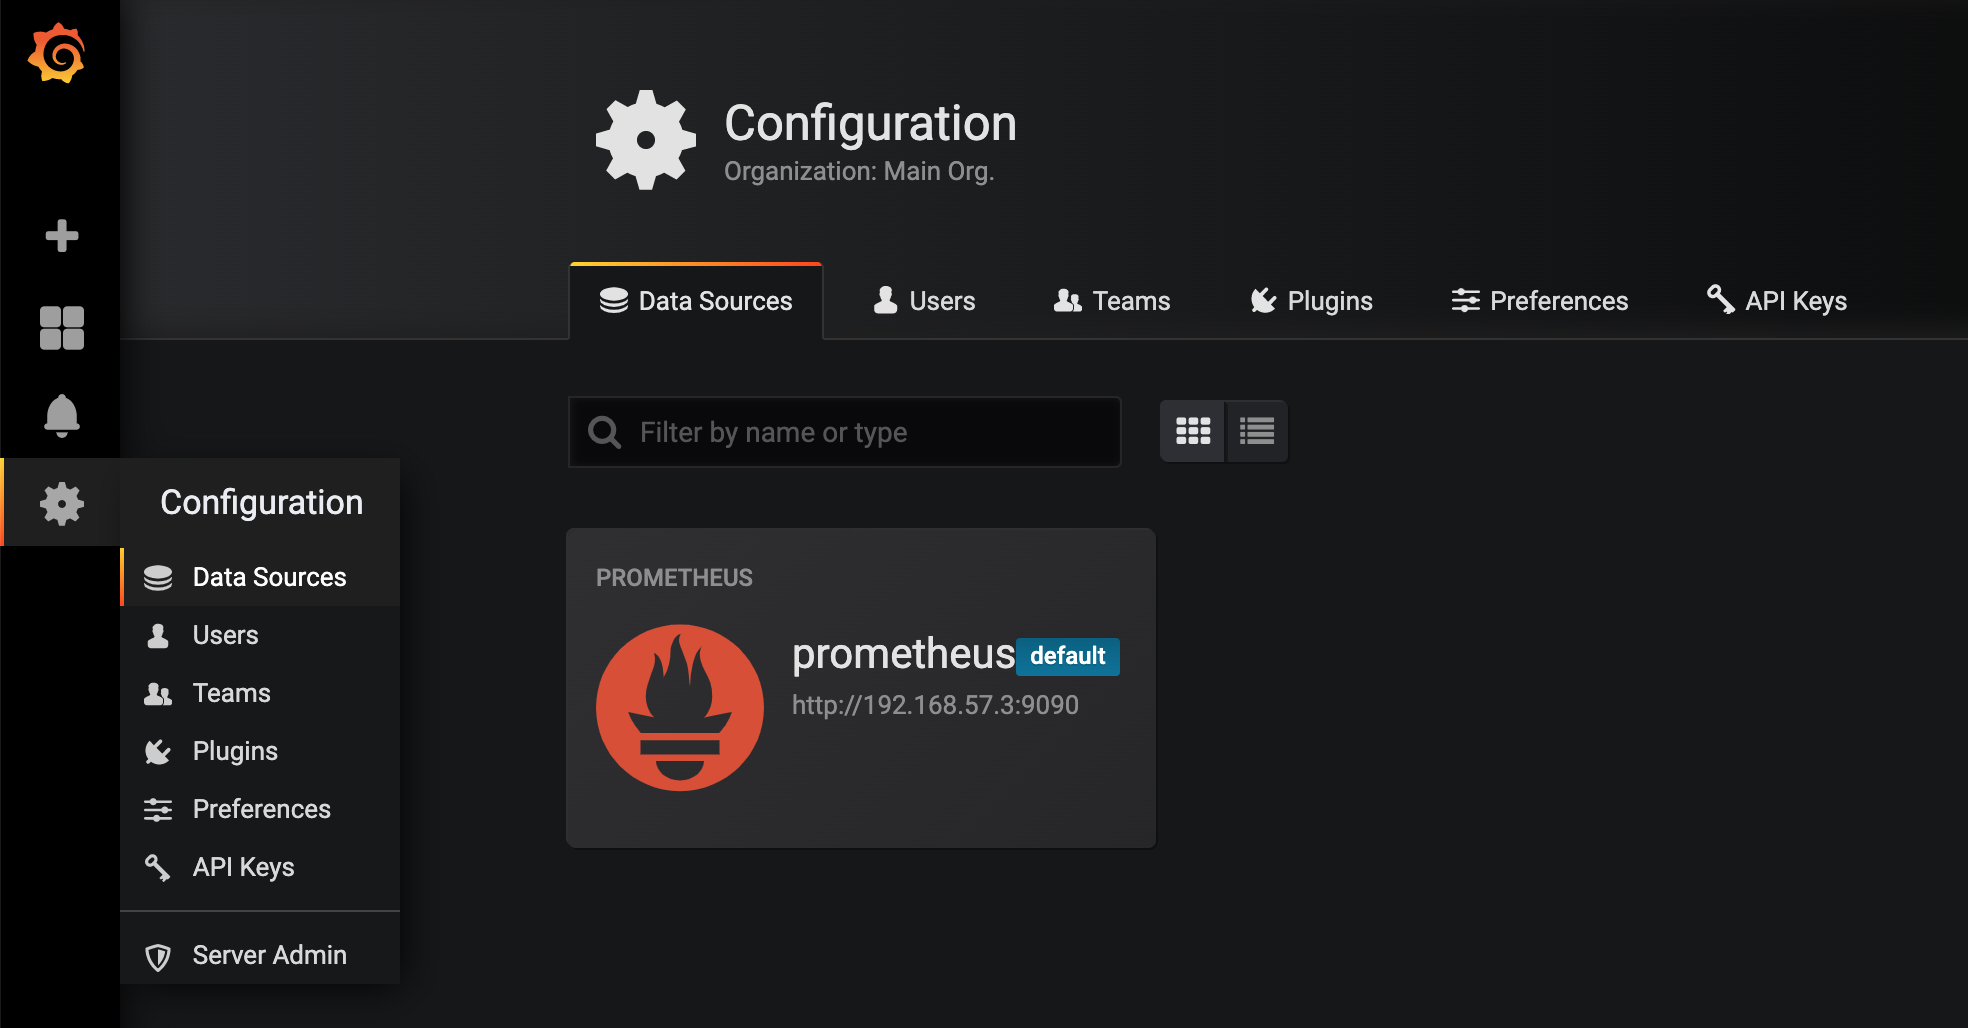
查看数据源
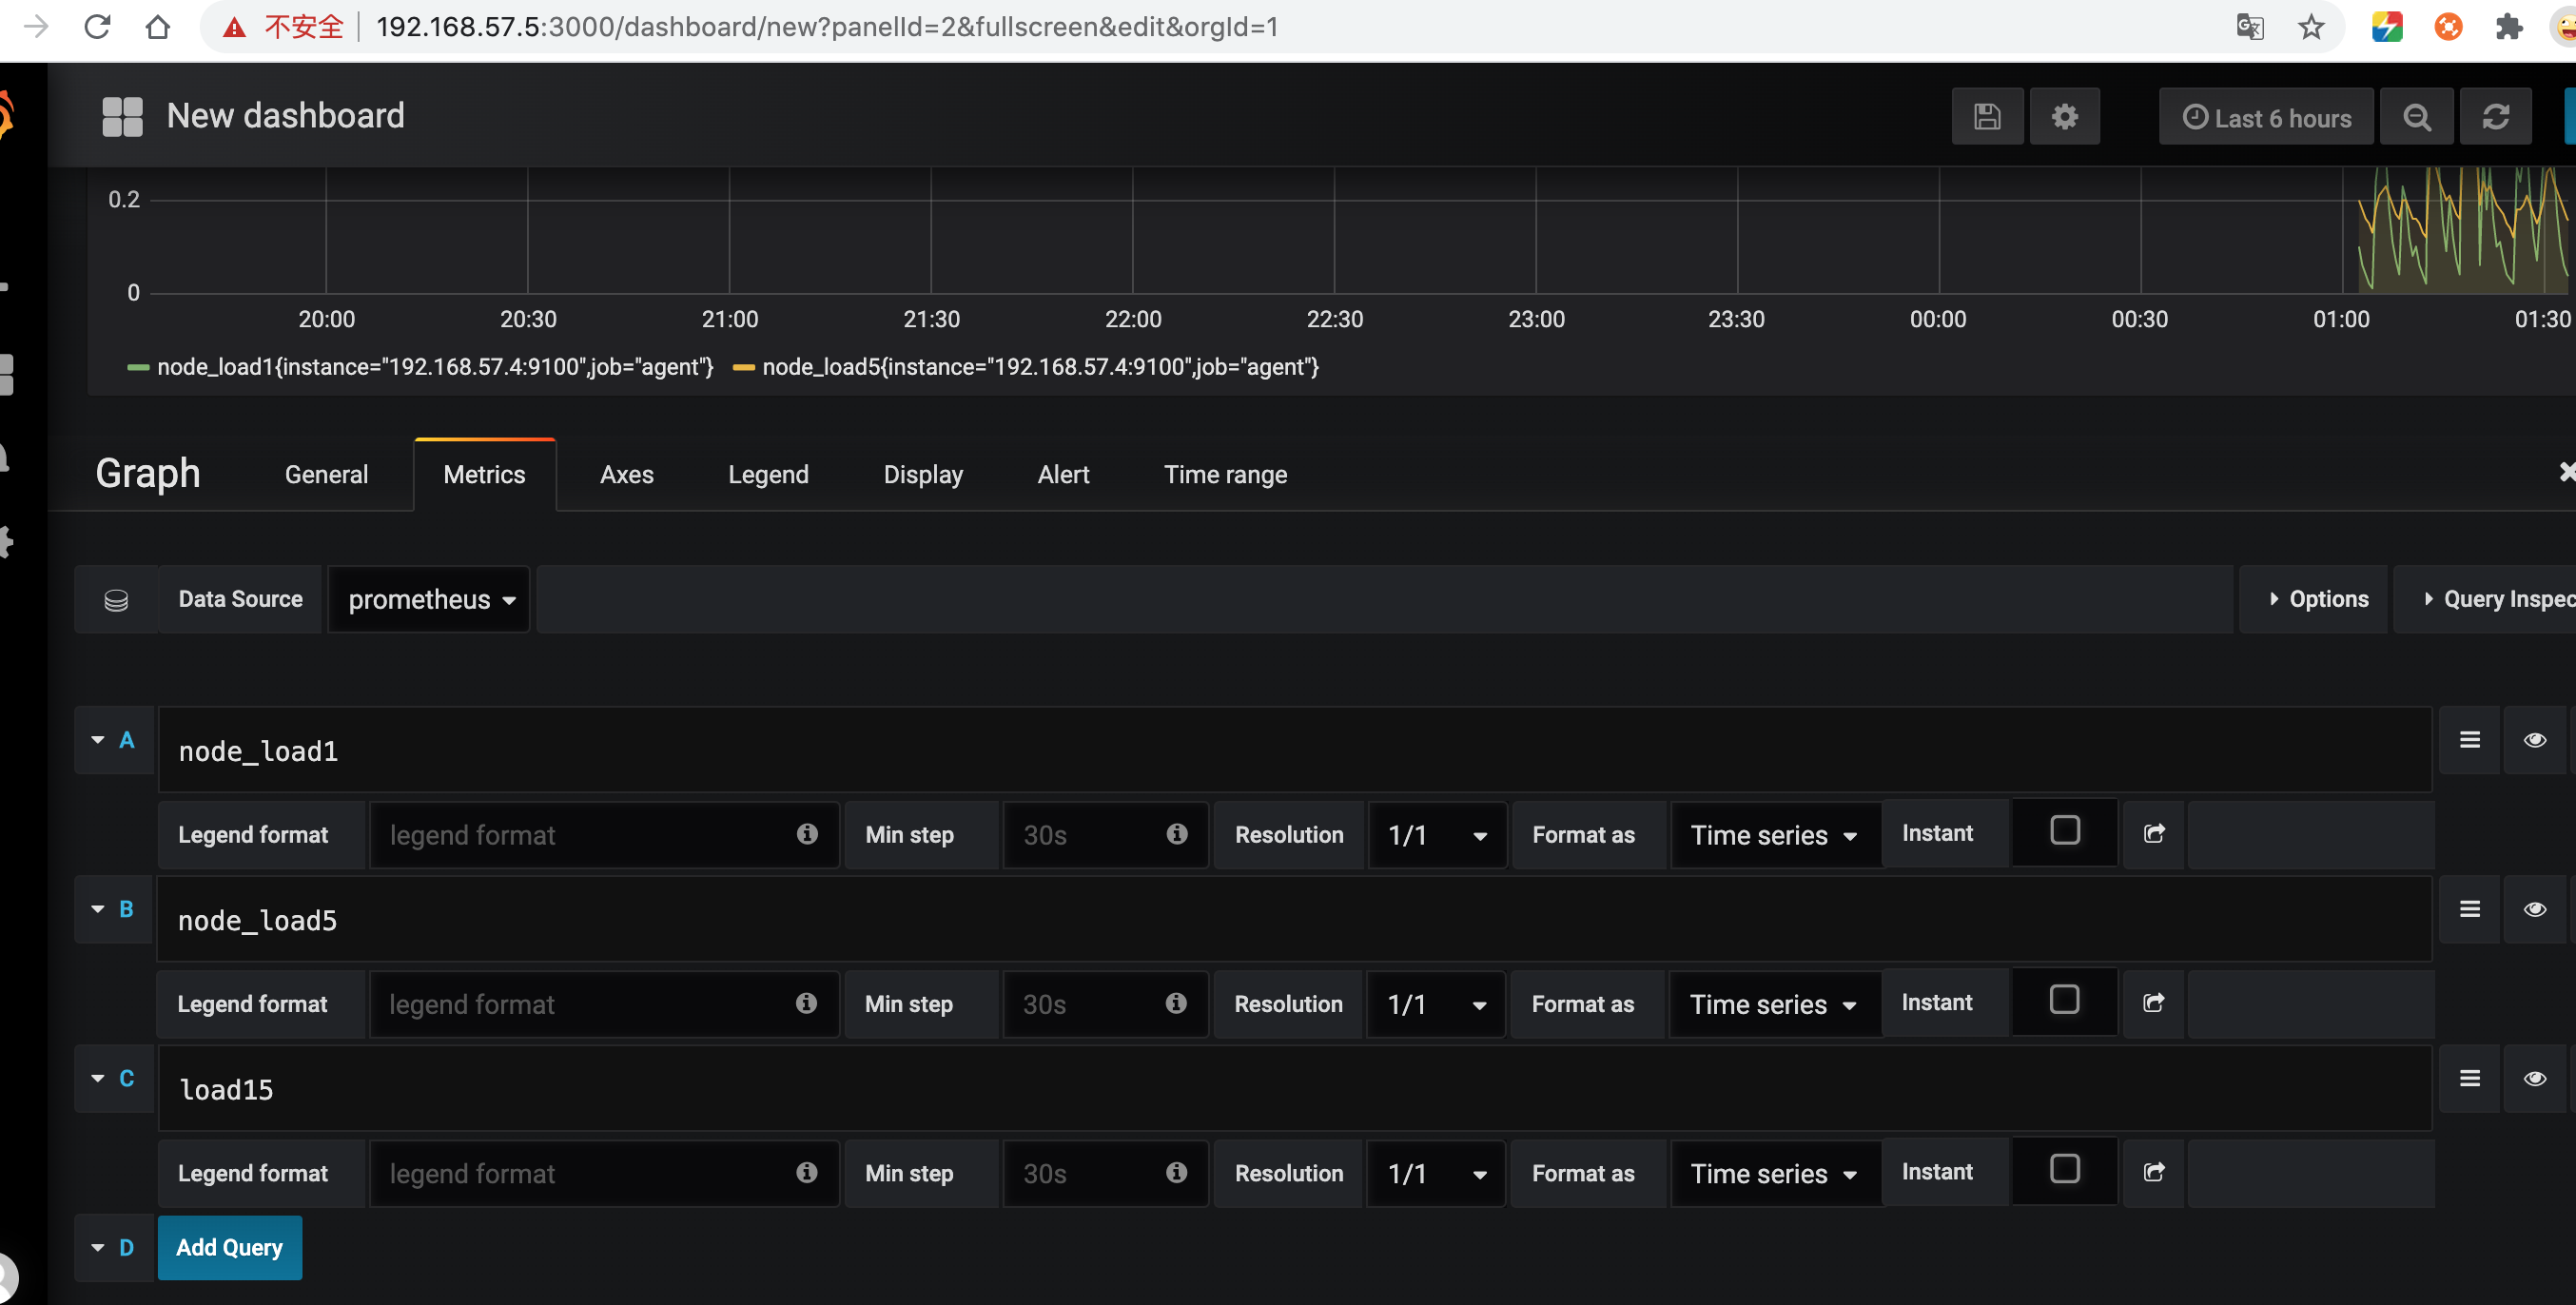
添加图形化展示
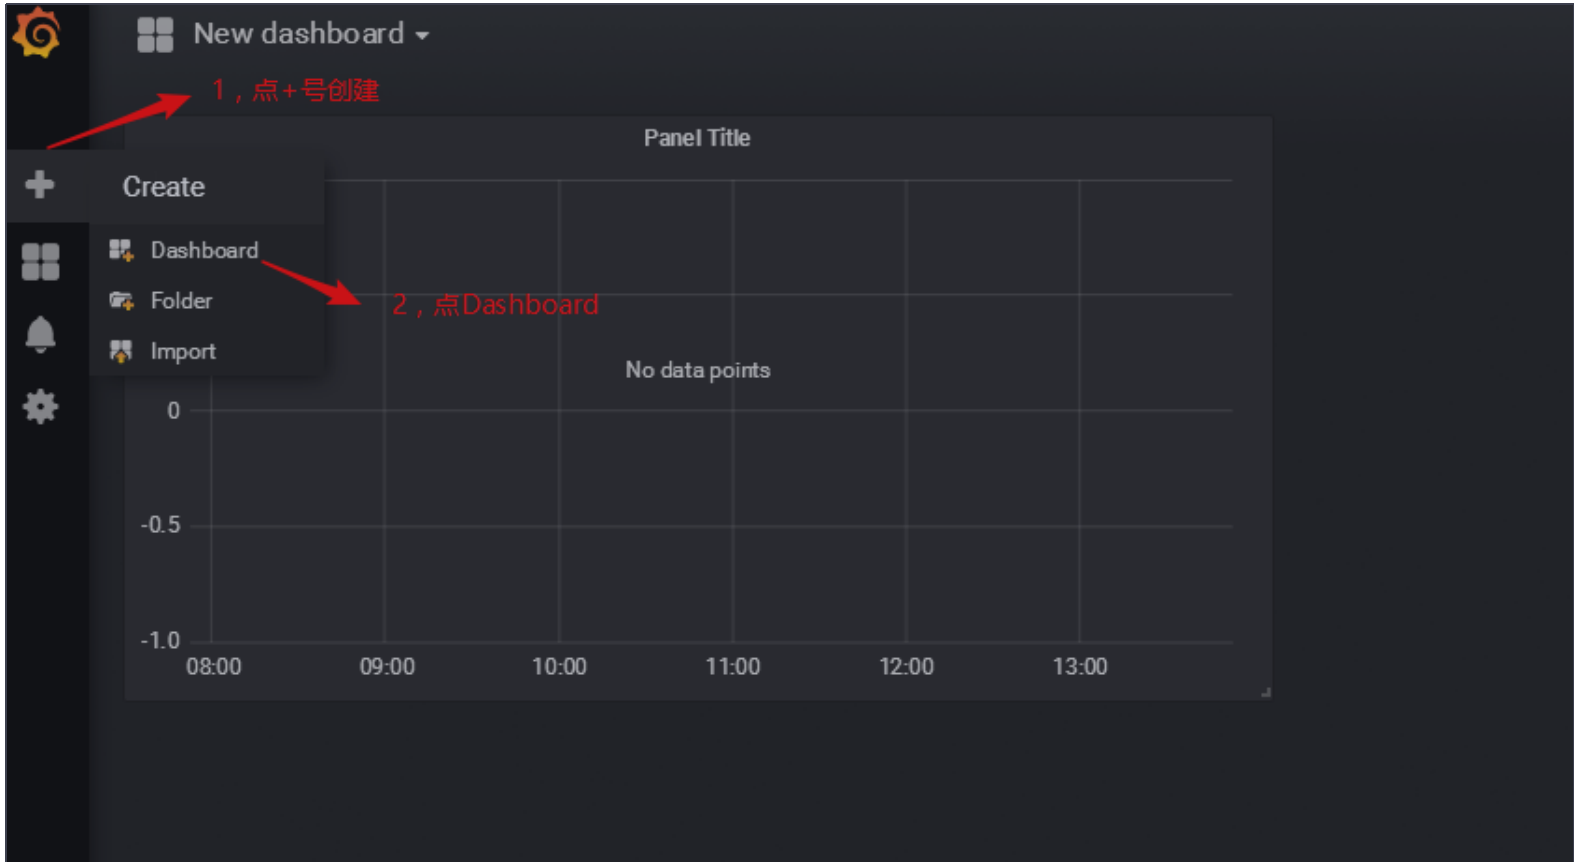

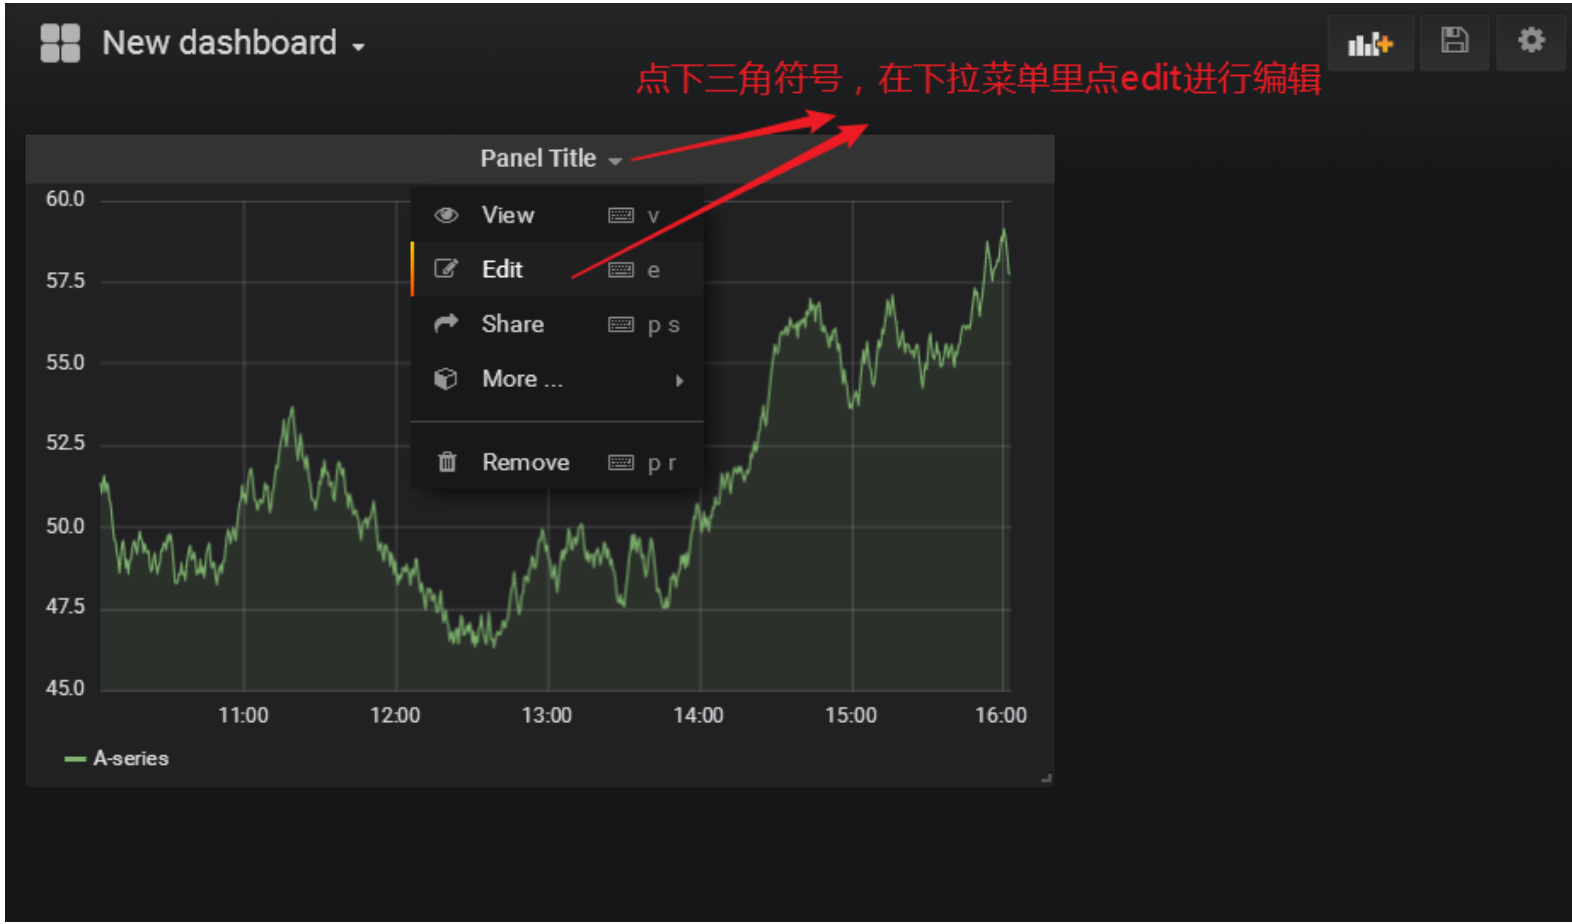
添加cpu 1分钟、5分钟、15分钟的图像,并保存,保存按钮在右上角第一个,
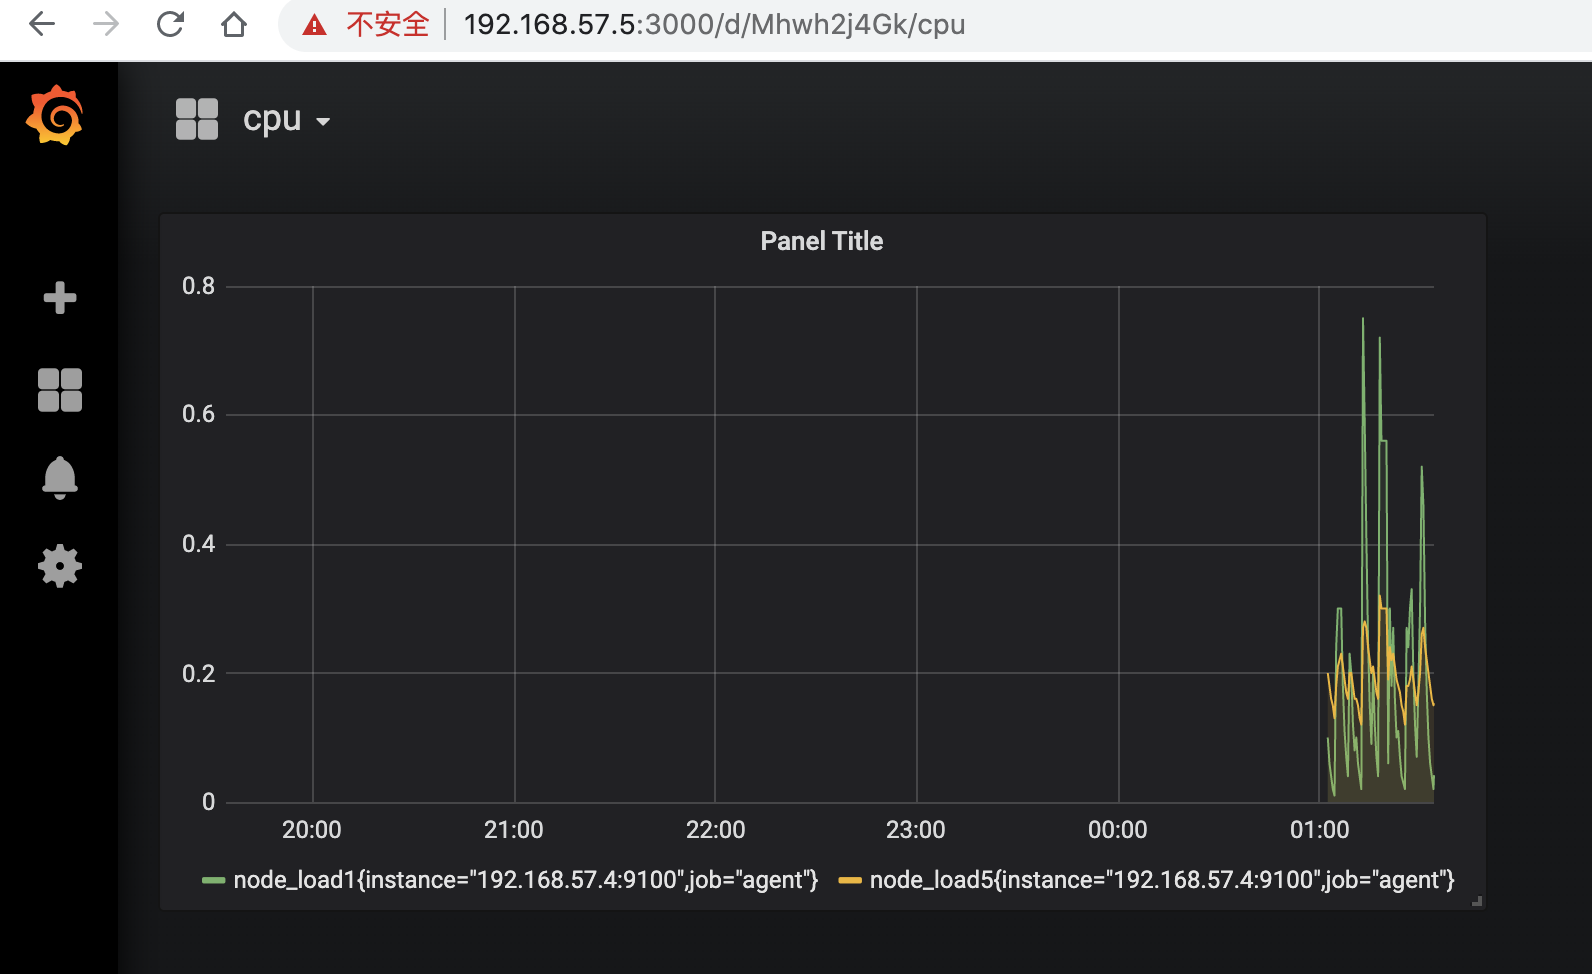
查看效果
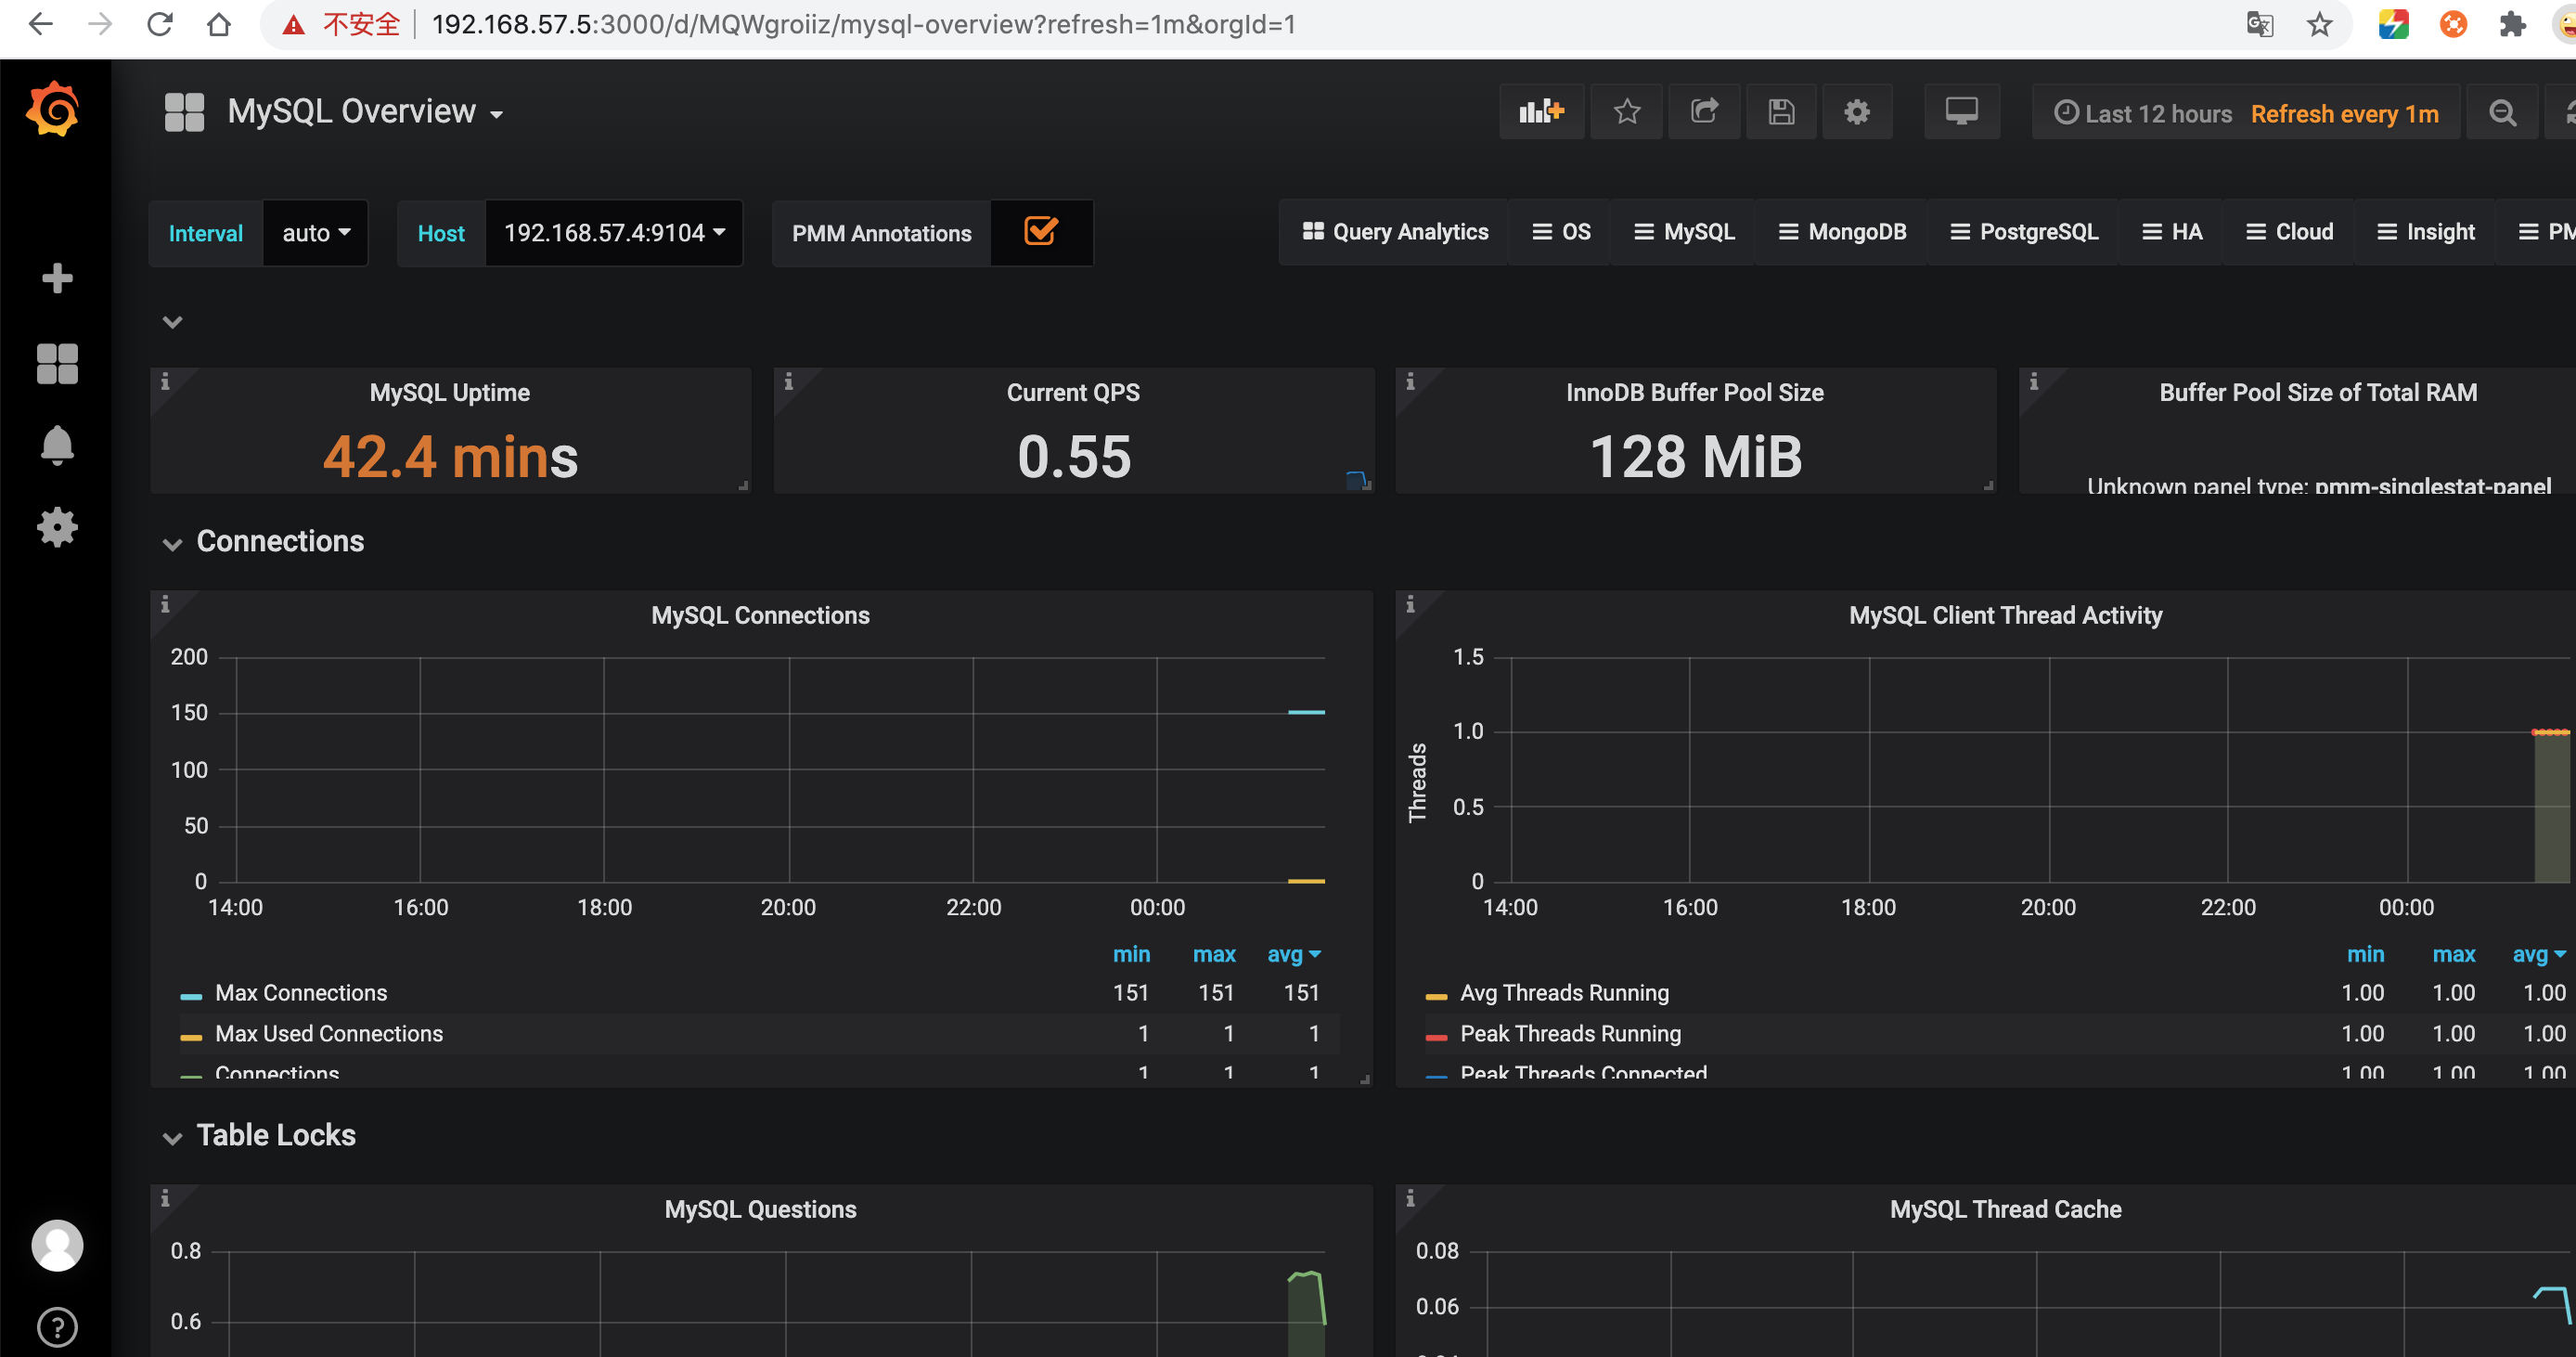
Grafana图形显示MySQL监控数据
在grafana配置文件里最后加上以下三行
[root@localhost ~]# vim /etc/grafana/grafana.ini
[dashboards.json]
enabled = true
path = /var/lib/grafana/dashboards[root@localhost ~]# cd /var/lib/grafana/
[root@localhost grafana]# git clone http://github.com/percona/grafana-dashboards.git
[root@localhost grafana]# cp -r grafana-dashboards/dashboards/ /var/lib/grafana/
重启grafana服务
[root@localhost grafana]# systemctl restart grafana-server在grafana图形界面导入相关json文件
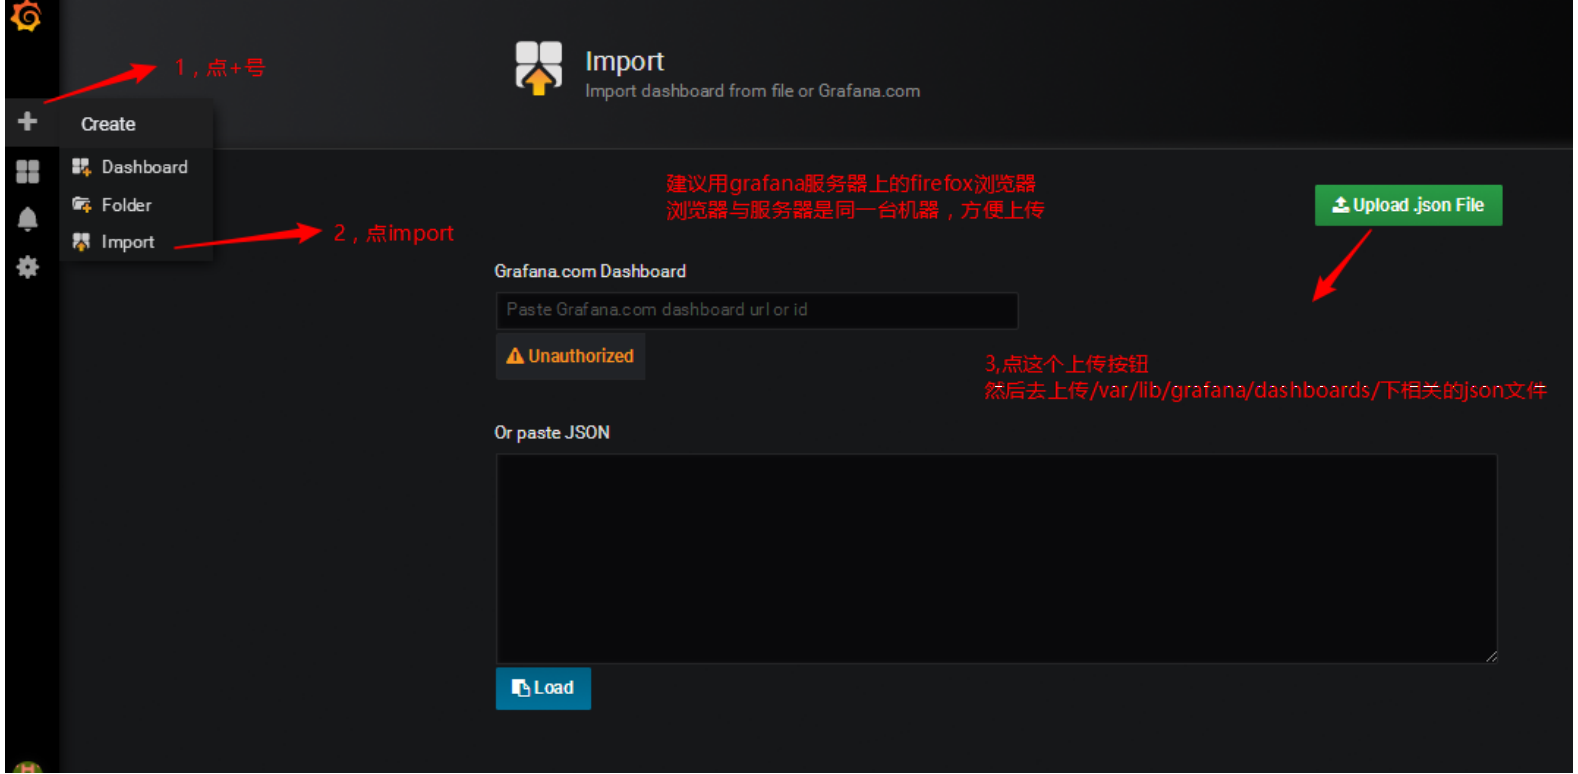
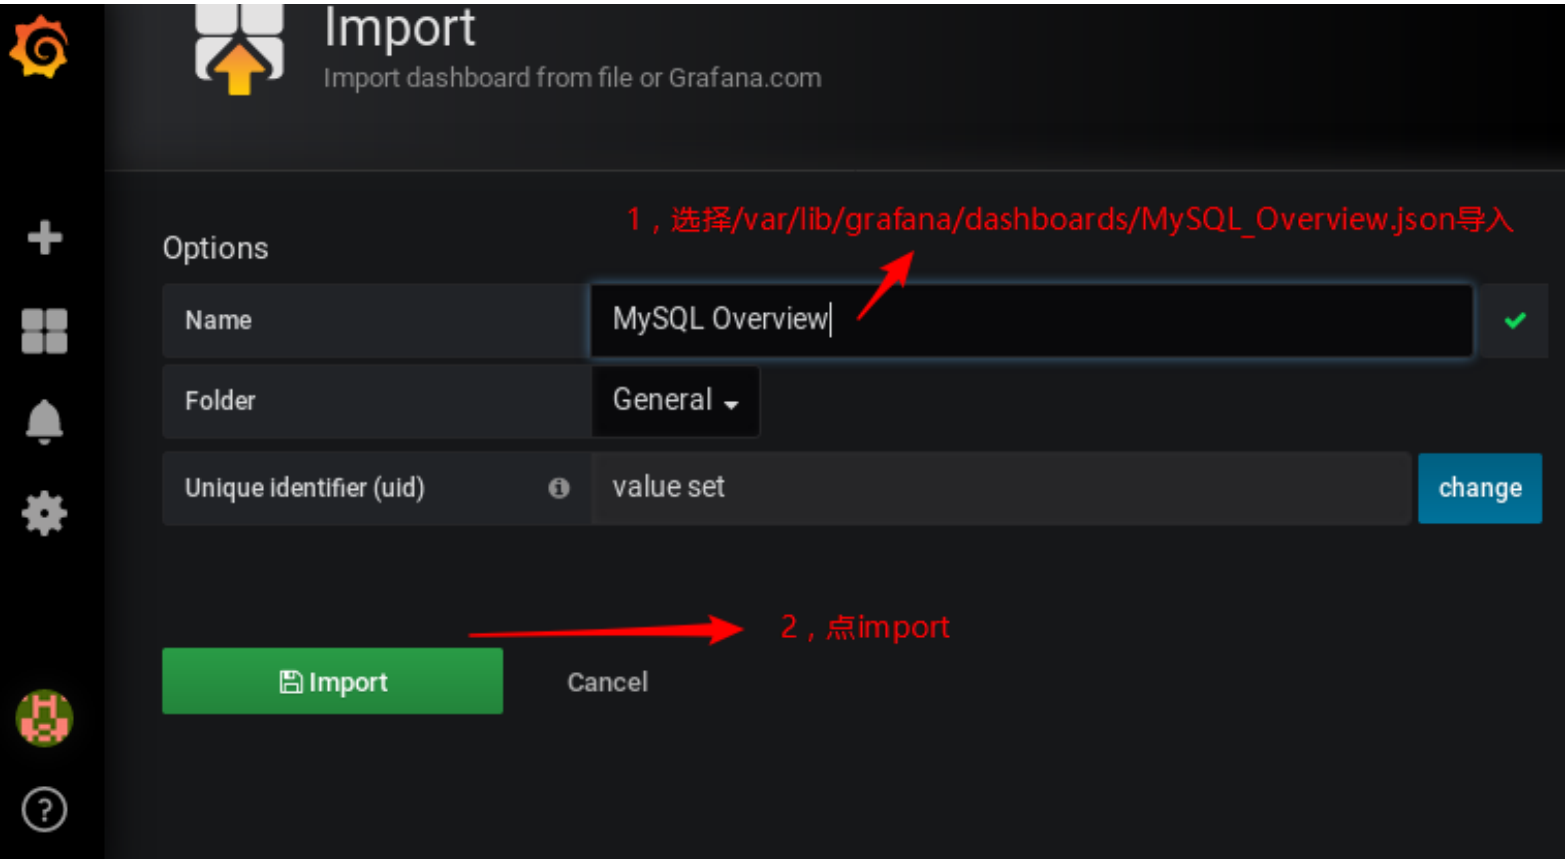
查看数据